Context
Rewind is a SaaS product that offers data backups for cloud applications. Initially launched for Shopify, it has since expanded to support multiple platforms, including Quickbooks, Jira, Confluence, GitHub, Quickbooks online, etc.
I designed a dashboard that demonstrates the value of the product to users at first glance.
Role
Senior Product Designer, leading UX and UI efforts.
User research, strategy, interaction, visual design, prototyping, testing.
Collaborated with product managers, marketing, customer service, sales and engineering.
The Problem
Users can't easily understand how the product is working and what other features are available. During the trial, our product value isn't obvious to users and sometimes they don't convert into paying customers. Additionally, many users aren't aware of the new platforms we were adding support for.
After signing in, users land on a page that displays a long list of items. They told us that it was unclear what this list meant.

Furthermore, at the end of the set up flow, users land on an empty screen. Most of the users at this stage are trial users. They told us that there was nothing to do here, and they would leave.
Business Objectives
- YOY revenue growth increase from under 20% to 25%.
- Fewer support inquiries about backup status.
- 200+ users link more than one integration.
Research Methods
To understand the problems in more depth I started with research. These are a few of the research methods I used.
- Analyzing internal literature related to this project.
- Watching recordings of users completing real tasks.
- Interviewing users (2).
- Interviewing stakeholders (10).
- Auditing our product.
- Analyzing competitors.
Design Sprint for Alignment
I invited the product team to a design sprint to understand more deeply our business goals and take advantage of their different perspectives.
We gathered for a few hours every day for two weeks, and collaborated in a Miro board. I prepared for the sprint by setting up the Miro board and synthesizing my research.
Understanding our users
Our Shopify customers bring 60% of our revenue. Furthermore, customers that need backups for their software development tools are a rapidly growing market for us. Therefore, we identified the following characteristics of our target users.
1. IT professional in an enterprise setting (IT administrator or manager).
- Responsible for data security and compliance.
- Needs to demonstrate compliance with data regulations.
- Needs audit trails and backup verification.
- Prefers automated backups with control and oversight.
2. Small business owner (Shopify or BigCommerce merchant, Quickbooks accountant).
- Needs simple, reliable backup solutions.
- Concerned about data loss affecting business operations.
- Limited time and technical expertise.
- Prefer set-it-and-forget-it automation with clear status updates.
Finding opportunities
During the sprint, I shared a list of problem statements, sythesided from my research, and we rephrased them into How Might We...

I created a user journey to visualize users' interactions and find opportunities for improvement. For example, at the step where users check the progress of a backup there's a lack of information, and users' questions remain unanswered.
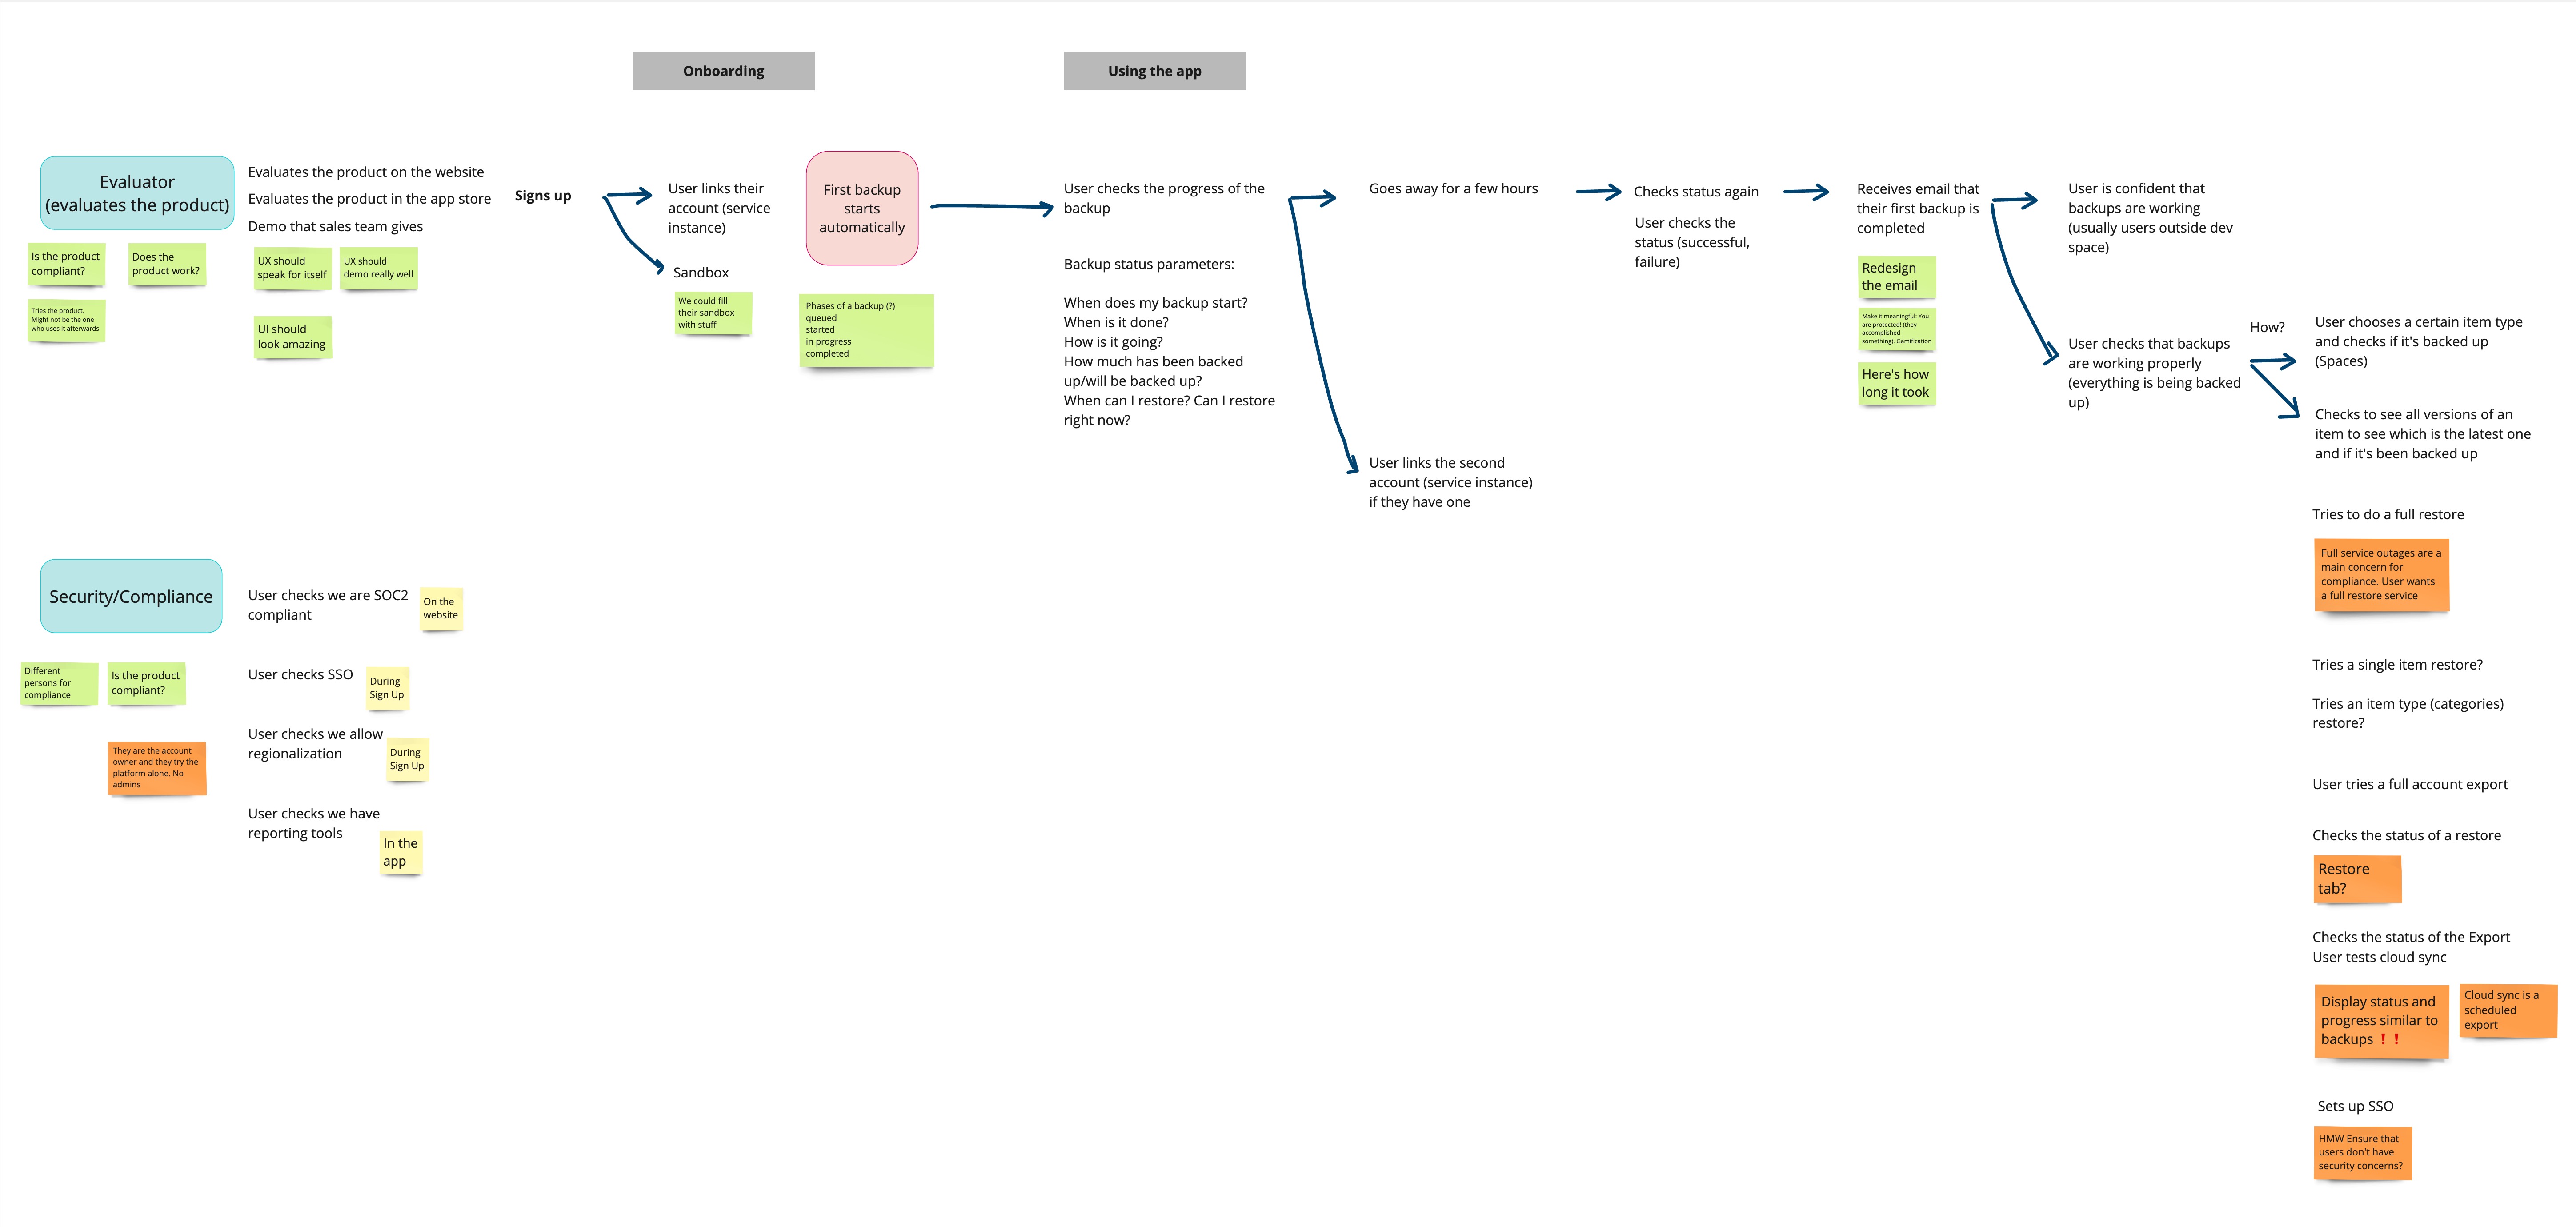
I created an object model with all the objects in our app. I wanted to offer the team a clear visual representation of the objects, their attributes, relationships with each other and actions. This was a helpful exercise for identifying interactions and for structuring the app.

Synthesizing User Needs
I reviewed the sticky notes from our sprint and synthesized user needs into following list.
- Quickly understand the product’s functionality.
- Have confidence the product is working as expected.
- Meet compliance requirements.
- Know if backups succeeded or failed and how to resolve issues.
- Monitor backup progress: start time, end time, how much has it been/will be backed up.
- Understand available actions during an in-progress backup (e.g., restore, export, etc.).
Planning and Prioritizing
Before the sprint, we were excited to redesign and improve almost all areas of the product. However, the sprint gave us a better understanding of our product, goals, timelines and resources. Due to budget and time constraints, we had to reduce our scope and focus on high impact changes with relatively low effort. After anaylizing all the data, I suggested the following plan that the team agreed on—though it was a difficult decision.
✔ Will do: introduce a dashboard
- Overview of all integrations and backups.
- Surface new available integrations.
- Collaborative with sales and marketing.
✔ Will do: revamp the global navigation
- Proper hierarchy.
- Improving discoverability.
- A solution that scales with the product.
✖ Won't do: reimagine the whole app
- Would follow more accurate mental models.
- Deep architectural changes.
- Updates to most of the flows and pages.
Design Concepts
I started with explorations of different options taking into account user requirements, business needs, stakeholder requests (marketing, sales, product, leadership) and technical considerations.
I explored a grid layout with three cards per row, each showing an integration. The top section displayed the last backup status, while the bottom showed the five most recent backups. Users could view more details via a button, and a three-dot menu provided additional actions. In a separate column on the right, there are suggested integrations and help links.
I discarded this approach because most users had only one integration, whcich meant that the page would be largley empty. The suggested integrations columns distracted from the primary focus—backup statuses

In another iteration, I explored placing suggested integrations in a dismissable banner at the top, followed by a section for backups in progress. The progress is represented by a spinner and a counter. Below, there is another section that shows completed backups in a table. At the bottom, I included a section with links to blog posts.
This iteration helped stakeholders visualize a few ideas that have been circulating, like using tables and featuring blog posts. Some suggested a table for integrations for users with hundreds of them. My response was that, based on our data, under 1% of our users fit this case. Although we needed to find a way to accomodate those, I suggested to prioritize the majority who had only one integration. To support my argument, I quickly mocked up a table. After reviewing this design, we agreed that tables weren't ideal, and blog posts cluttered the page. We kept the backup in progress concept and suggested integrations section, which I refined further.

Overcoming Design Challenges
One of the challenges was to get everyone on the same page and agree on a solution. I took a collaborative approach and involved all relevant stakeholders in the process. I showed them different options, incorporating their requests while providing my own rationale. I kept user and business goals in mind and guided the discussions towards the most effective solution.
My final proposal and the one we agreed on, was a list of cards, one for each integration. The cards have a colour-coded left edge, to help users easily identify the status of their last backup. Each card also includes the ten most recent backups and their statuses and buttons for the actions requested by users.
At the bottom, there is a section with recommended integrations, which are dynamically updated based on what users have already linked. For example, if Jira is already linked, we recommend another integration Jira users are likely to need.

Testing
I built a prototype and tested with 6 participants recruited through the User Interviews platform.
Study Goals
1. Validate that the dashboard improves the experience and offers a clearer view of our product at first glance.
2. Validate that the dashboard integrates seamlessly with the rest of the product.
3. Validate that users notice and welcome recommendations for integrations.
Testing Summary
+
- Clean and uncluttered UI.
- Easy to navigate and understand.
- Good overview of the backup status.
- Clear indicators for backups in progress and those needing attention.
- Users welcomed recommendations for additional integrations.
!
- Click on each of the “recent backups” icon to see what exactly have been backed up.
- Duration of the backup and how much of the backup is completed.
- Spinner is distracting.
- Search functionality for larger number of integrations.
Final Iterations
Below are screenshots of the final designs that include a redesgined navigation as well. I wrote a separate case study on that.
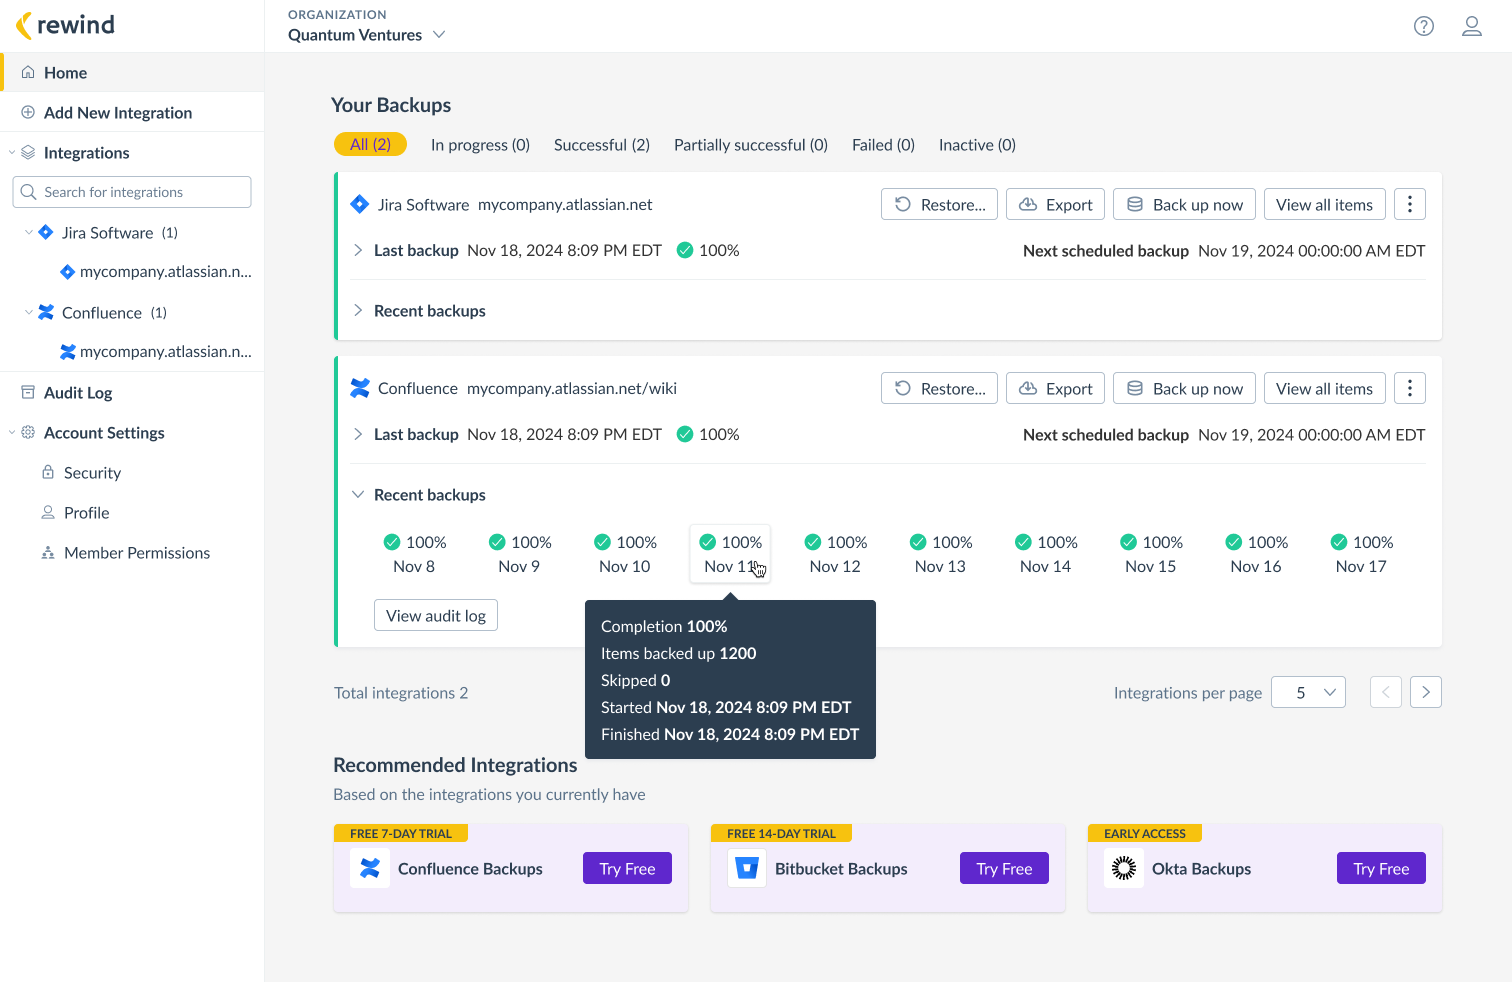
I incorporated user feedback and replaced the distracting spinner with a progress bar, accompanied by the percentage of completed backup and a counter of the items backed-up.

Added a tooltip on hover, to provide more details on finished backups.
When a backup is not 100% successful, we don't mark it as failed, as that would be inaccurate and could unnecessarily stress users. Instead, we label it as partially successful and display the success percentage.
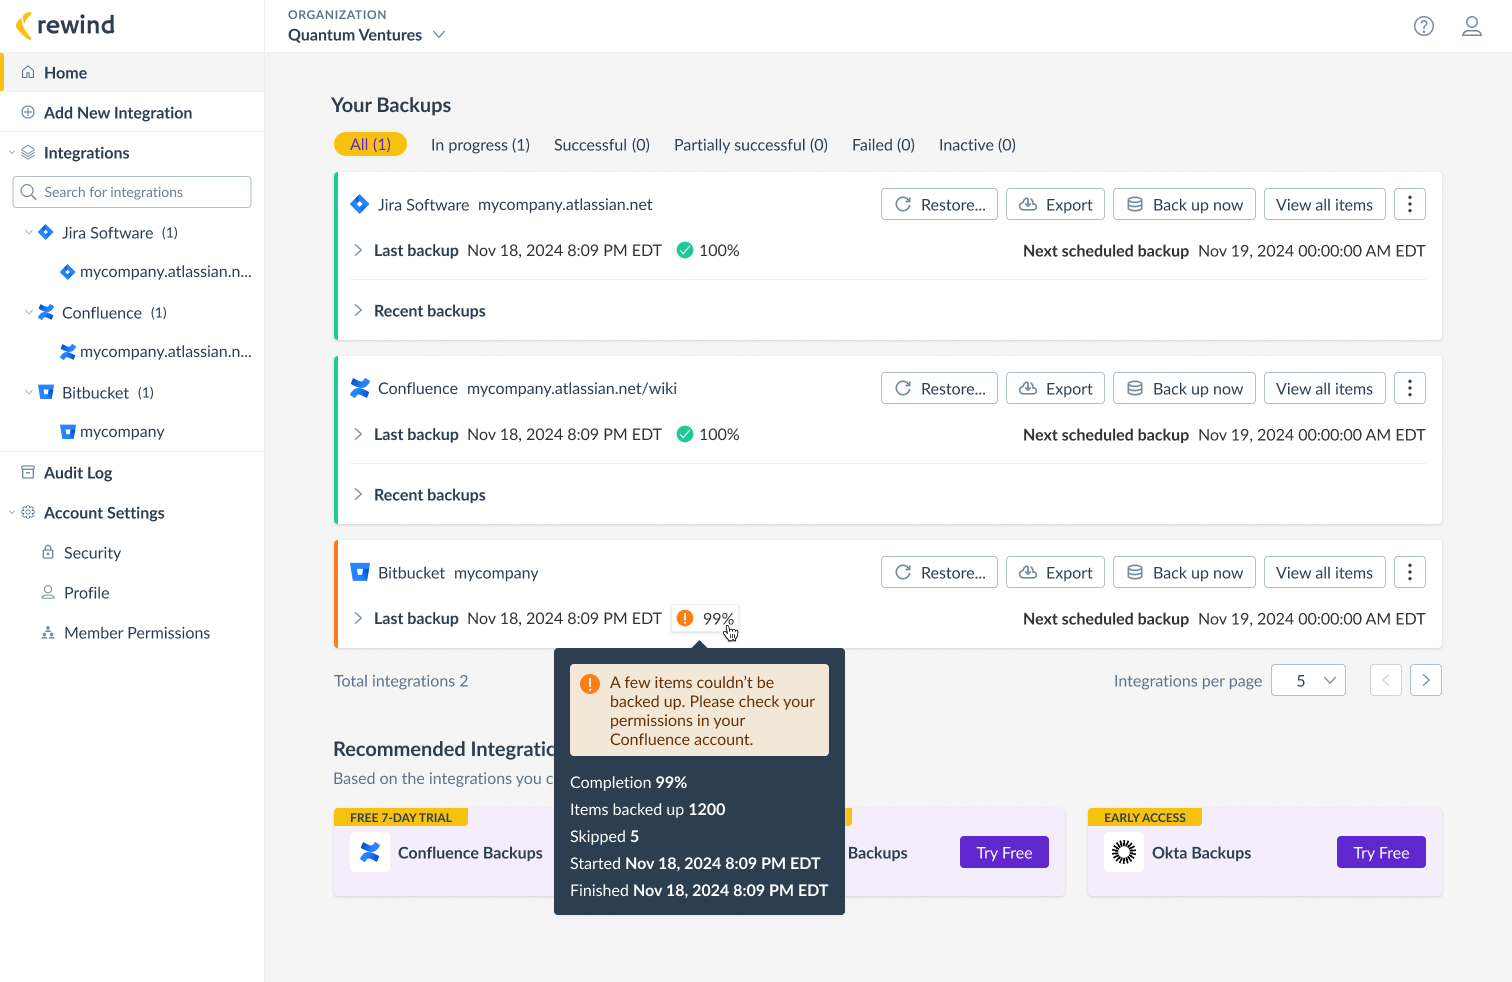
If a backup is 0% successful, it indicates a serious issue either on our end or the user's. For these cases, I added red error banners with clear messaging and steps to resolve the issue.

Implementation and Launch
While the developers focused on implementing the dashboard, I worked on the navigation redesign. Through effective cross-team collaboration, we managed to launch both at the same time, avoiding user confusion.
Unfortunately one of our main challenges was lack of front-end developers. We had to make hard decisions and implement the MVP while still providing value to our users.
I worked closely with engineers to ensure a smooth implementation, helping troubleshoot design and code bugs.
I collaborated with the Product Manager to create timelines and keep our delivery on track. I also helped put together documentation and the Product Requirements Document (PRD).
I partnered with the Marketing Director and the Customer Service team to help create walk throughs and documentation for our Knowledge Hub, published on our public website.
Measuring Success
Feedback
Positive
"Good overview of the backup status for various integrations, with clear indicators for backups in progress and those needing attention, such as reauthorization."
Rewind User
"We've been watching Rewind Admin and there are a bunch of new Klaviyo installs that are coming from Shopify customers... New UI is working!"
Engineering Manager
Less Positive
"Recommended integrations section is unnecessary. IT professionals understand their backup needs. This is not Netflix."
Rewind User
Metrics
10% increase in linked integrations
10% of our Shopify users added a second integration (Klaviyo).
1 million in revenue
By July 1, 2024, we surpassed 1 million in revenue from Atlassian platforms, jumping form silver partners directly to platinum.
4 ⭐ increase in average rating
Average rating increased from 2.5 to 4 ⭐ (Altassian web store).
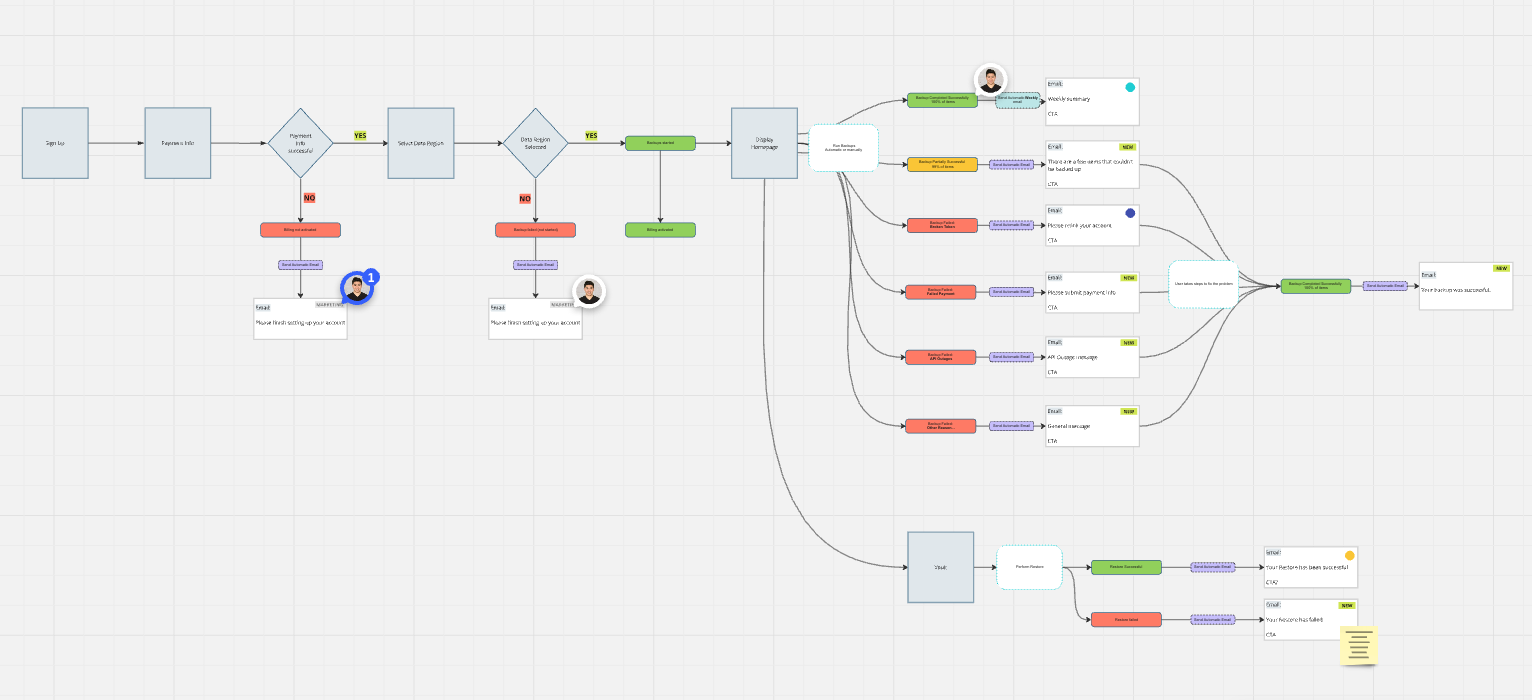
Next Steps
Create and deliver an email notification system to complement the dashboard, keeping users informed about the status of their backups and integrations. I mapped out the notification flow in Miro and reviewed it with the Product Manager. The next steps involve designing the emails and collaborating with the team to implement them.